Hello again! To-day I’d like to talk about another area of applied mathematics – fractals, and more specifically – Mandelbrot sets.
To begin with, Mandelbrot sets are just that – sets. A set is just a group of numbers. For instance, the set of even numbers is:
{-Infinity, ..., -4, -2, 0, 2, 4, ..., Infinity}
And the set of numbers either divisible by 2 or 3 is:
{-Infinity, ..., -6, -4, -3, -2, 0, 2, 3, 4, 6, ..., Infinity}
Now let’s plot the numbers in the set on a real number line. (Obviously, we can’t plot all the numbers, but let’s do a small portion of them).
We’ll color the points that we’ve plotted black and leave the others white.
So, in our second example, the coloring goes as follows:
-6: black-5: white-4: black-3: black-2: black-1: white
The Mandelbrot set is constructed the exact same way, except for one crucial difference: the set is in two dimensions. This is because the Mandelbrot set consists of complex numbers, which consist of a real part (on the x-axis) and an imaginary part (on the y-axis). The numbers in the set are colored black, the ones outside the set remain white.
To make a long story short, we get the following:
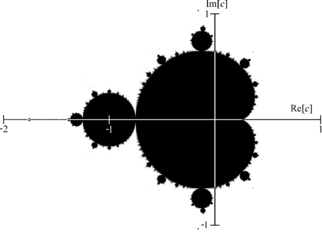
What’s amazing is that the set is extremely accurate, so if we zoom in on any part of the set, we still get a clear image. This property is a typical characteristic of fractals – we can zoom in indefinitely and produce ever more interesting patterns.
But, we haven’t answered one question: What is the set?
It’s much easier than you think. Let’s take the function:
zn+1 = (zn)2 + c
where c is the complex number under question.
So, how do we determine whether a complex number c is in the set or not? We start with:
z0 = 0
and we apply the iteration repeatedly, in other words, we calculate the values of z1, z2, z3, .... If the value tends towards infinity, then c is not in the set. Otherwise, it is.
Let’s take two examples: 1 and -1.
z0 = 0;
z1 = 02 + 1 = 1
z2 = 12 + 1 = 2
z3 = 22 + 1 = 5
z4 = 52 + 1 = 26
z5 = 262 + 1 = 677
...
So, 1 is not in the set, as the result of the function tends toward infinity.
How about -1? Let’s see…
z0 = 0;
z1 = 02 + (-1) = -1;
z2 = -12 + (-1) = 0;
z3 = 02 + (-1) = -1;
z4 = -12 + (-1) = 0;
z5 = 02 + (-1) = -1;
...
So, -1 is in the Mandelbrot set, as it does not tend toward infinity.
Just a bit of terminology here: if the values in a set tend toward infinity, it is unbounded. Hence, the results from applying the function on -1:
1, 2, 5, 26, 677, ...
represent an unbounded set.
And if the values in a set do not tend toward infinity, it is bounded. Our second set of results,
-1, 0, -1, 0, -1, ...
is bounded.
This is it! It’s that easy!
Sequel
You may have noticed that many Mandelbrot set images are not black and white, but colorful ones. Well, the principle behind that is also easy: we color each point in the set depending on how fast the values we get from that point tend toward infinity. This work is difficult (read: impossible) to do by hand, so it is usually done in a computer program, resulting in images like the following (slideshow!):
Thanks for reading! I hope you’ll appreciate the beauty and intricacies of the Mandelbrot set along with this blog post! Stay tuned for more!
